Debugger
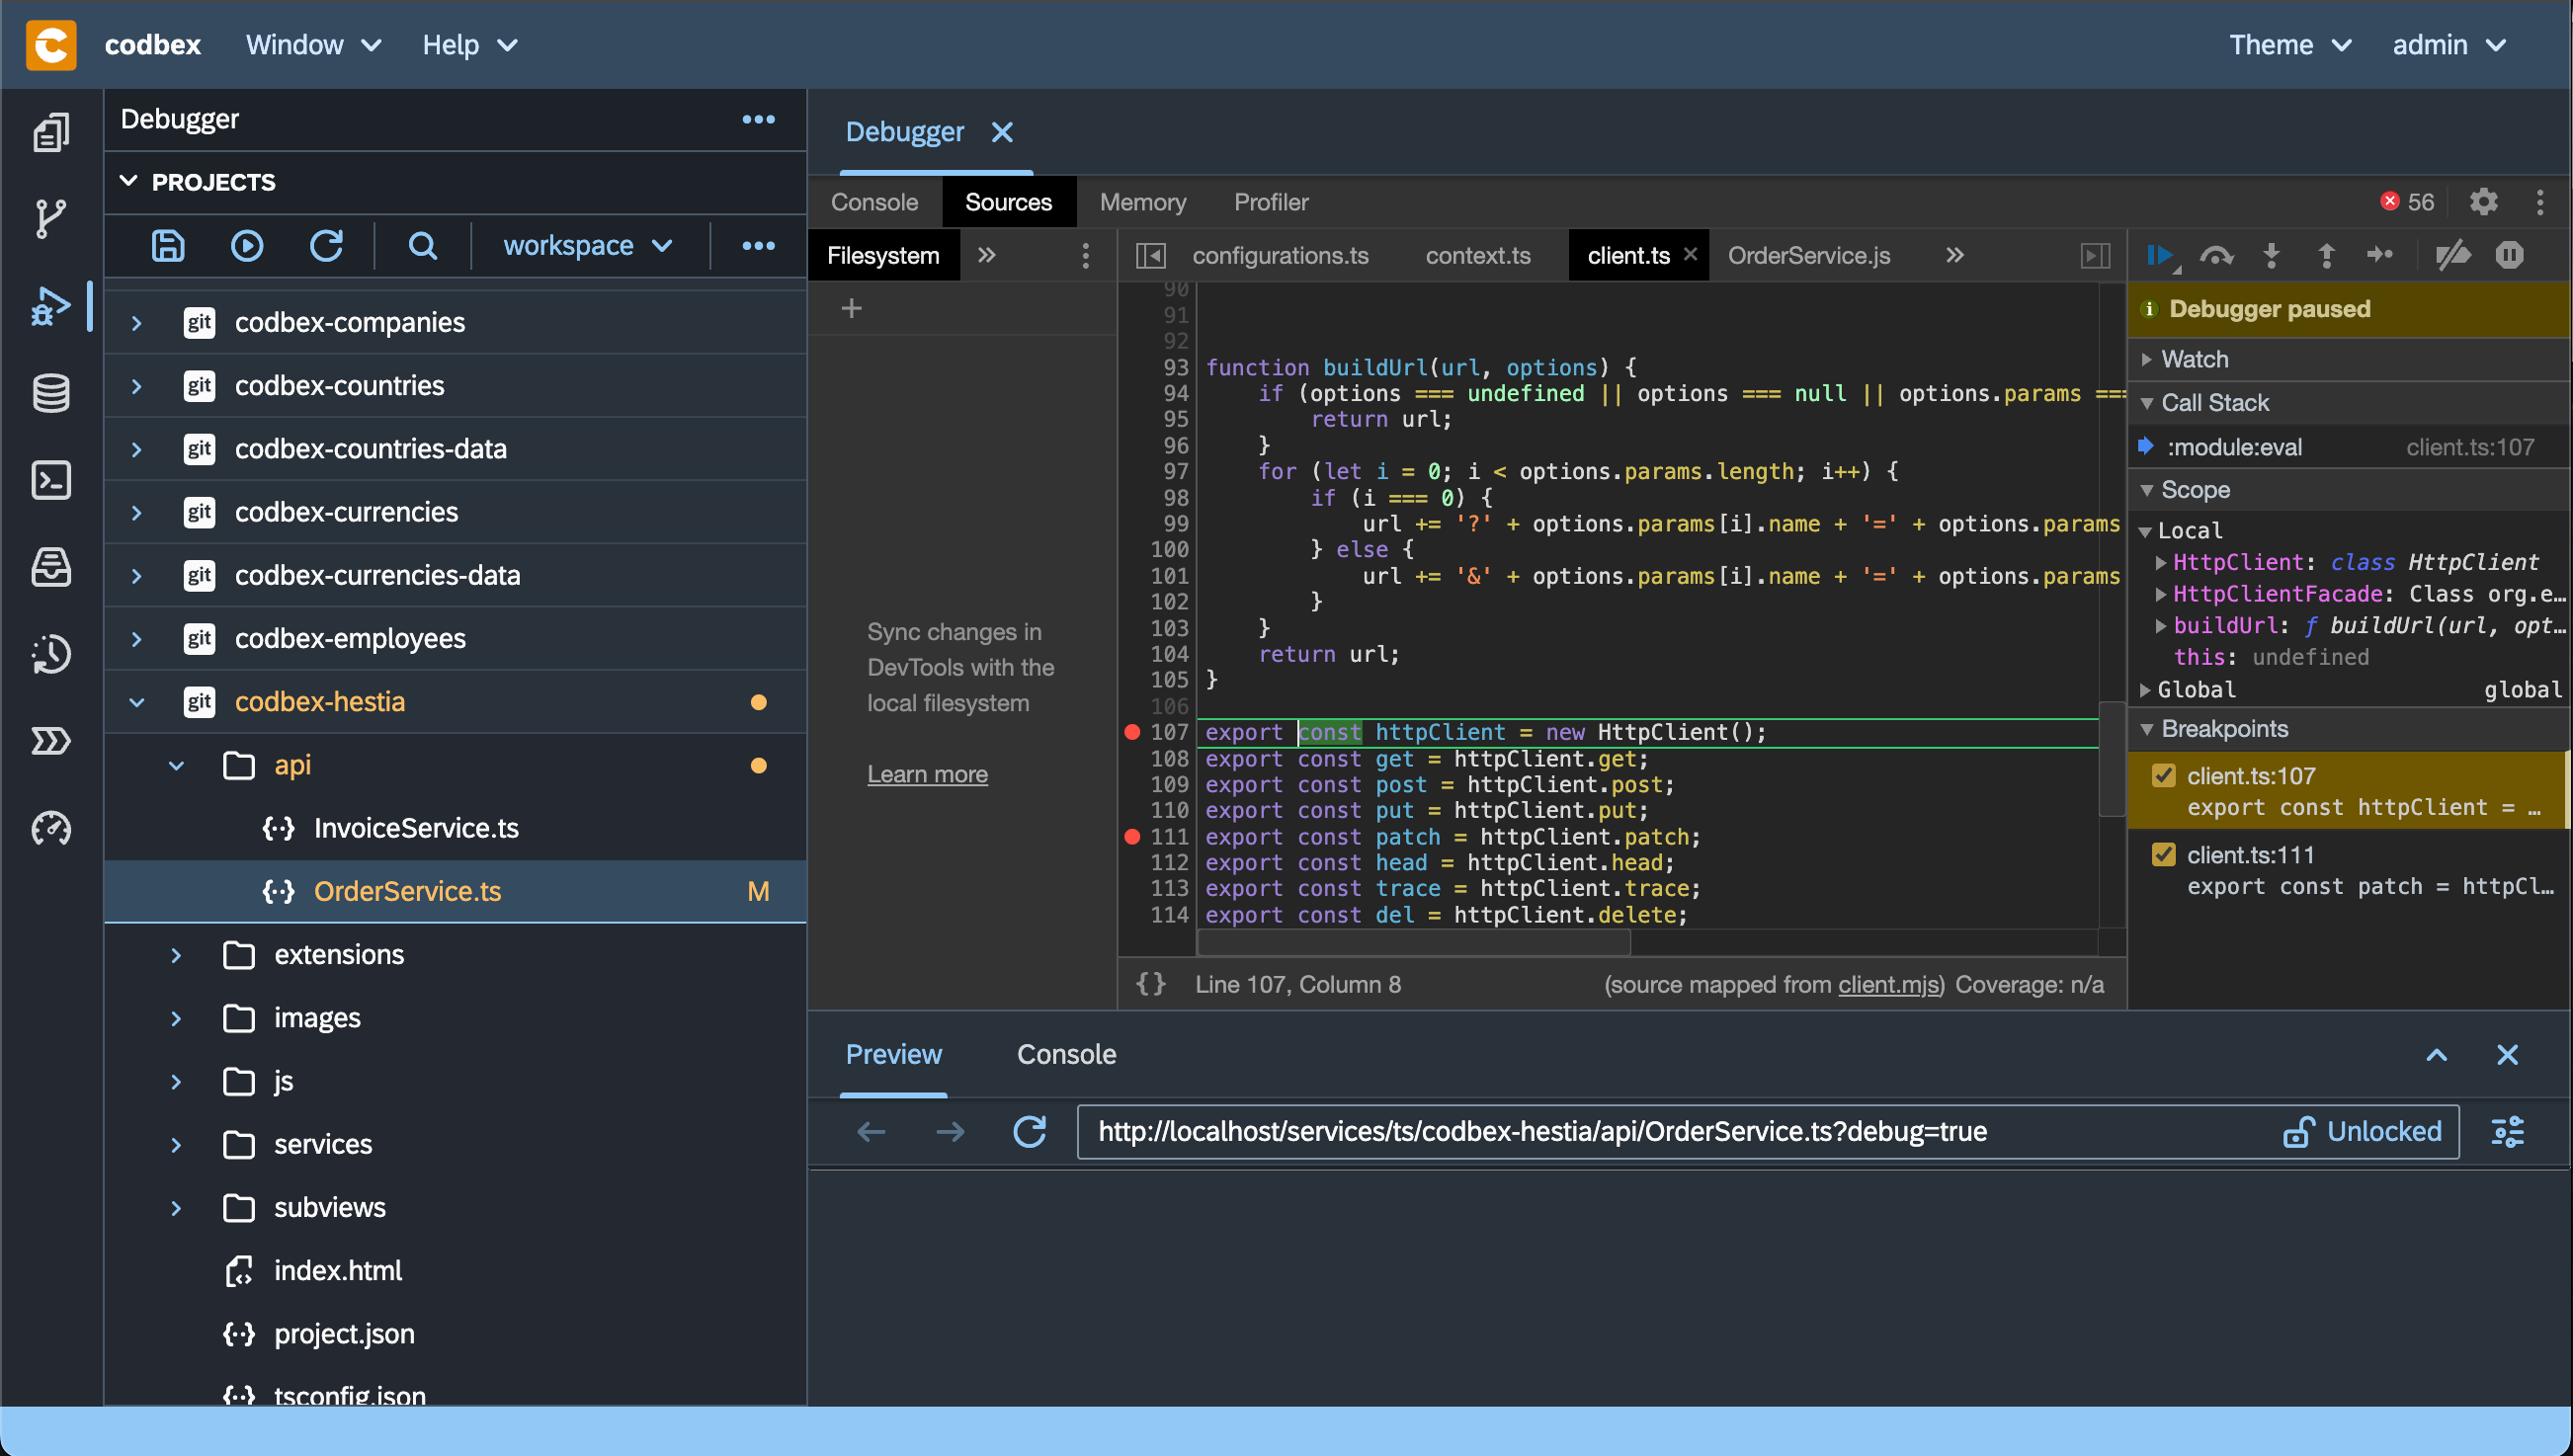
The "Debugger" perspective in the codbex provides a seamless integration with the Chrome DevTools, enabling developers to debug and analyze JavaScript and TypeScript applications running on the codbex runtime. This section covers key features and actions available in the Debugger Perspective.
Getting Started
Open the Debugger Perspective:
- Navigate to the Debugger perspective. This perspective is designed to facilitate efficient debugging and analysis of server-side JavaScript and TypeScript code.
Connect to the Runtime:
- Connect the debugger to the runtime by selecting a server-side JavaScript or TypeScript file in the Projects view.
Features
1. Source Code Inspection:
- Explore and inspect the source code of your JavaScript and TypeScript applications. View the hierarchy of files and navigate through the codebase effortlessly.
2. Breakpoints:
- Set breakpoints in your code to pause execution at specific lines. This allows you to inspect variables, step through code, and identify issues in your application logic.
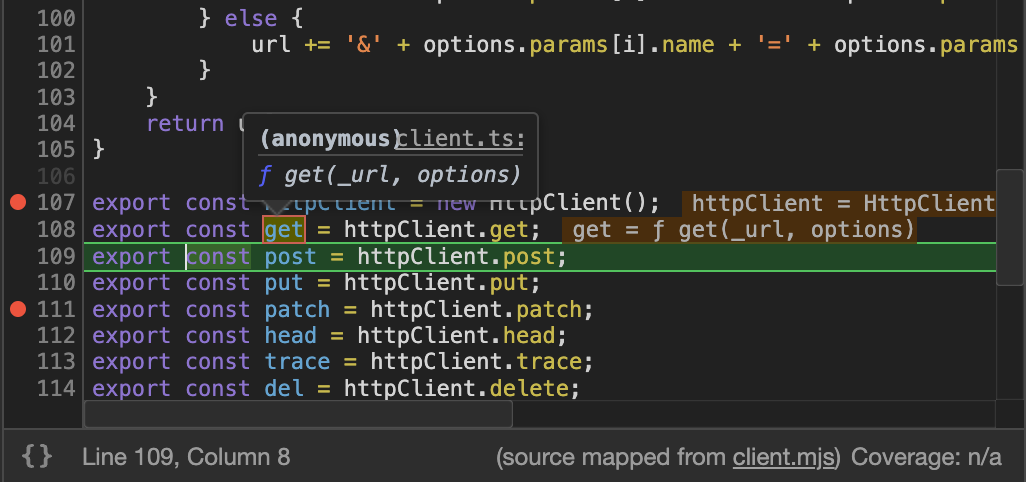
3. Step Through Code:
- Use the step-through functionality to execute code line by line. This is invaluable for understanding the flow of your application and identifying the cause of issues.
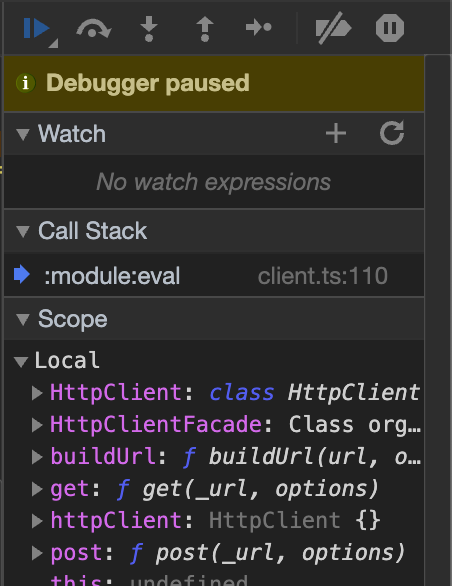
4. Variable Inspection:
- Inspect the values of variables at different points in your code. The Debugger Perspective provides a comprehensive view of variable values, making it easier to troubleshoot.
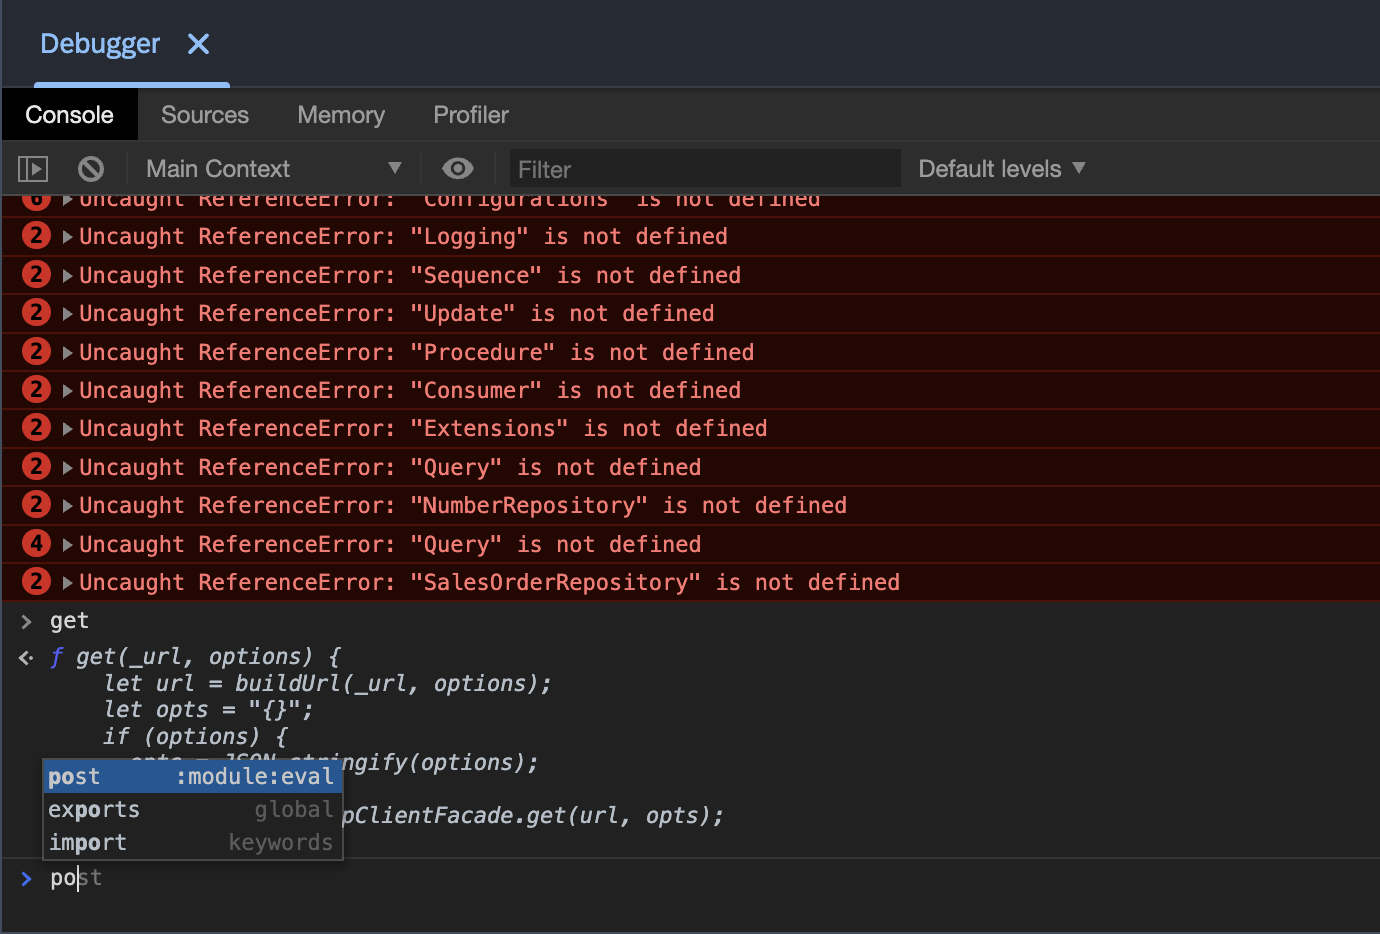
5. Console Integration:
- The integrated console allows you to execute JavaScript code directly in the context of your application. This can be useful for quick testing and exploration.
6. Memory Profiling:
- Utilize memory profiling tools to identify memory leaks and optimize memory usage in your applications. This feature is crucial for improving the overall performance of your code.
Advanced Debugging
Remote Debugging:
- Extend the debugging capabilities to remote instances of the codbex runtime. This is particularly useful for debugging applications deployed on different servers.
Breakpoint Conditions:
- Set conditions for breakpoints to control when the debugger should pause execution. This allows for more fine-grained control over the debugging process.
Async Function Debugging:
- Debug asynchronous functions and promises efficiently. The Debugger Perspective supports advanced debugging features for applications that heavily rely on asynchronous programming.
Conclusion
The "Debugger" perspective in the codbex platform, based on Chrome DevTools integration, provides a robust environment for debugging and analyzing server-side JavaScript and TypeScript applications. Leverage its features to identify and resolve issues in your code, ensuring the reliability and performance of your applications.